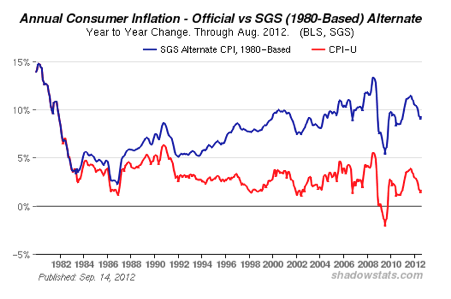
www.shadowstats.com uses the methodology employed by the US government in the past to determine economic data and trends. As this article in Amphora Report explains, the means of arriving at statistical data points by government agencies has changed over time and in every discernible case, the change has tended to make the government performance appear better. The blue line on the above graph indicates the changes in the Consumer Price Index, what can be considered the level of inflation, with the methodology used in 1980 to determine those figures. The red line displays CPI levels year-by-year using the changes adopted by those generating the statistics. Under the developed criteria, US inflation is presently about 2%. If it was determined with the same methodology as used in 1980, the annual level of inflation in 2012 would be just under 10%, as any of us who have purchased eggs, beef or motor fuel could attest.

A similar graph compares the "official" unemployment rate (red line) with the unemployment rate as it was compiled in 1980 (blue line). Draw your own conclusions.
No comments:
Post a Comment